
See how your marketing lands before you ship.
P/26 shows you how a specific audience will interpret your page, social media posts, or ad campaign, days before it goes live.
Currently in use by



By the time you find out, the budget is already gone.
A/B tests and analytics tell you after the fact. Focus groups could tell you sooner, but they're slow, expensive, and easy to bias. Between the two, most launches still go out on a hunch.
Get your insight in three steps.
Define your audience
Industry, market maturity, channel, objective, and constraints. That profile is what P/26 simulates against.
Upload the work and the scope
A landing page, a social media post, or an ad. Tell P/26 what it's meant to achieve.
Get your perception dashboard
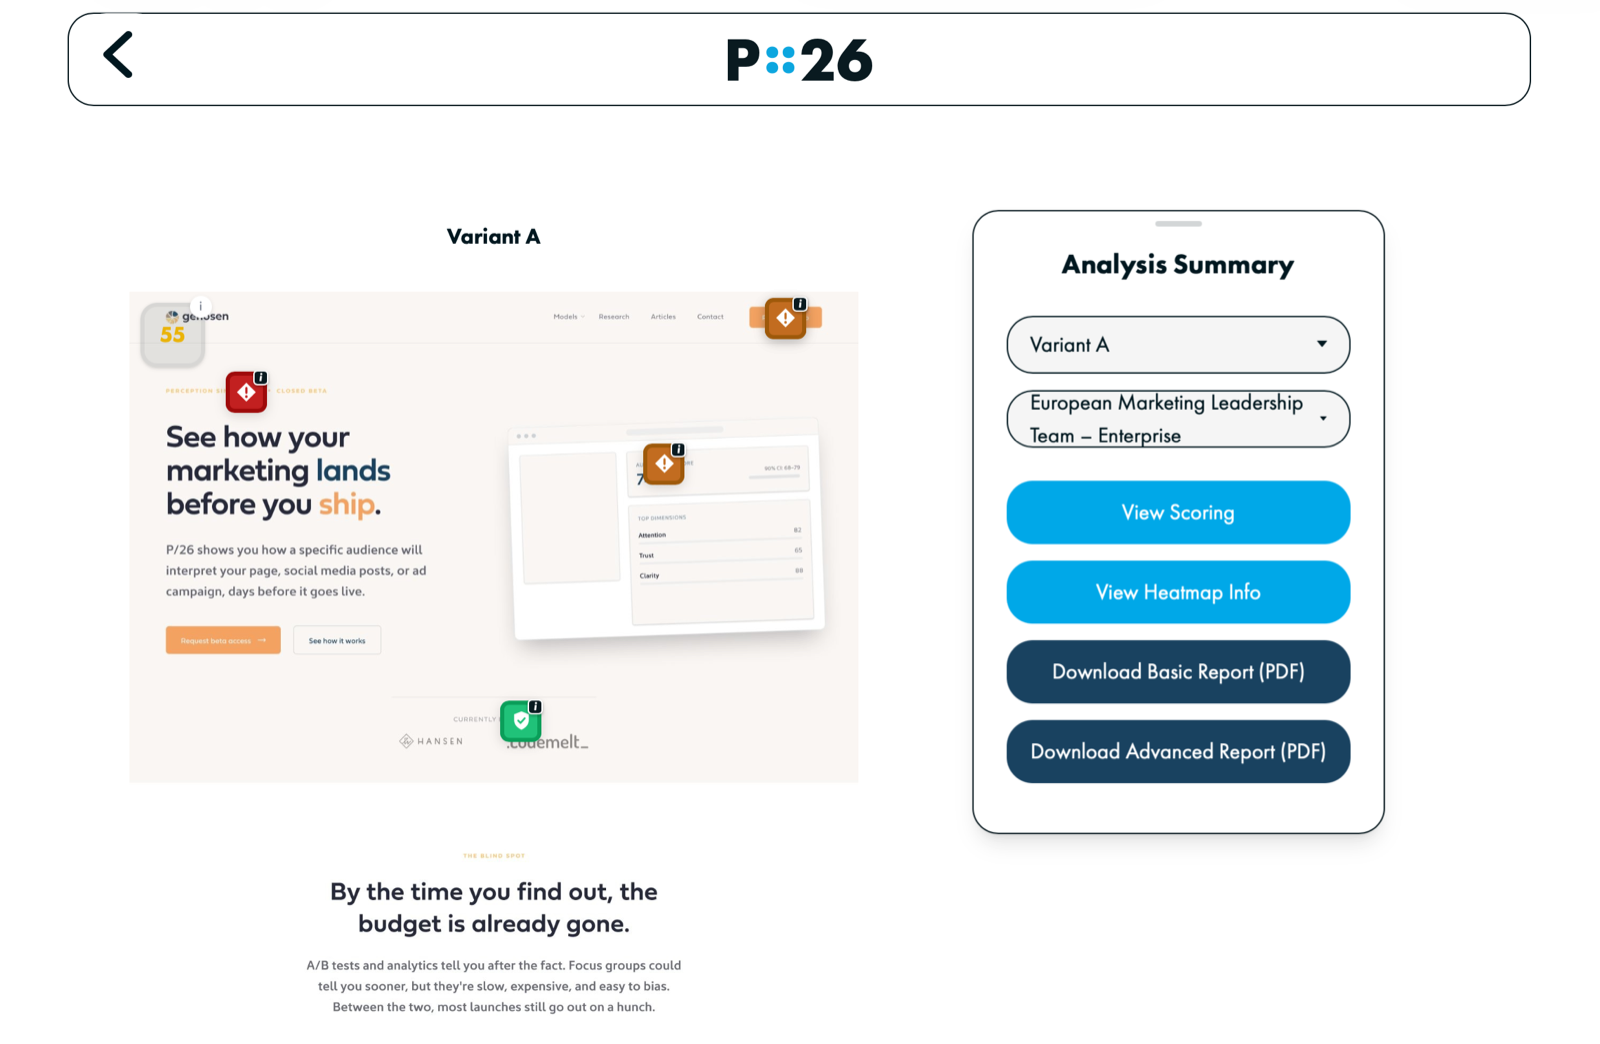
A dashboard with your scores, heatmaps, and ranked fixes, plus a report you can export.
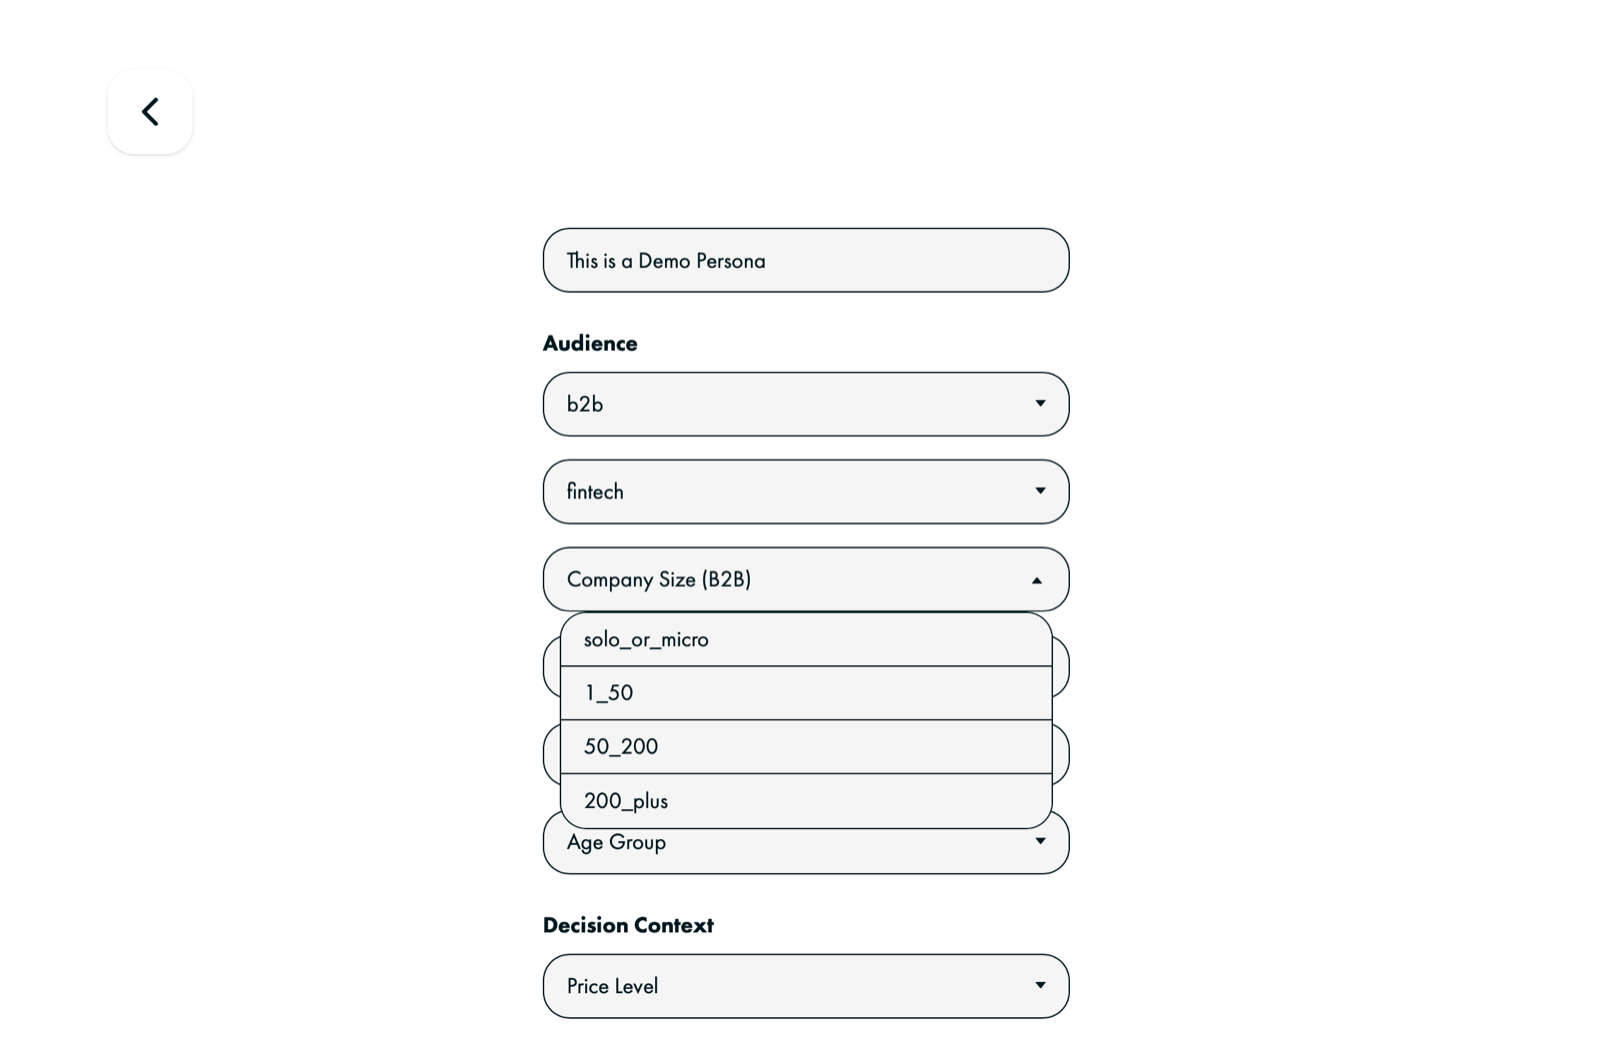
Describe the audience you're speaking to
One structured profile: industry, maturity, channel, objective, constraints. Build it once, reuse it on every artefact.
- A short structured form
- Save it, reuse it
- Upload a brand book to lock in constraints
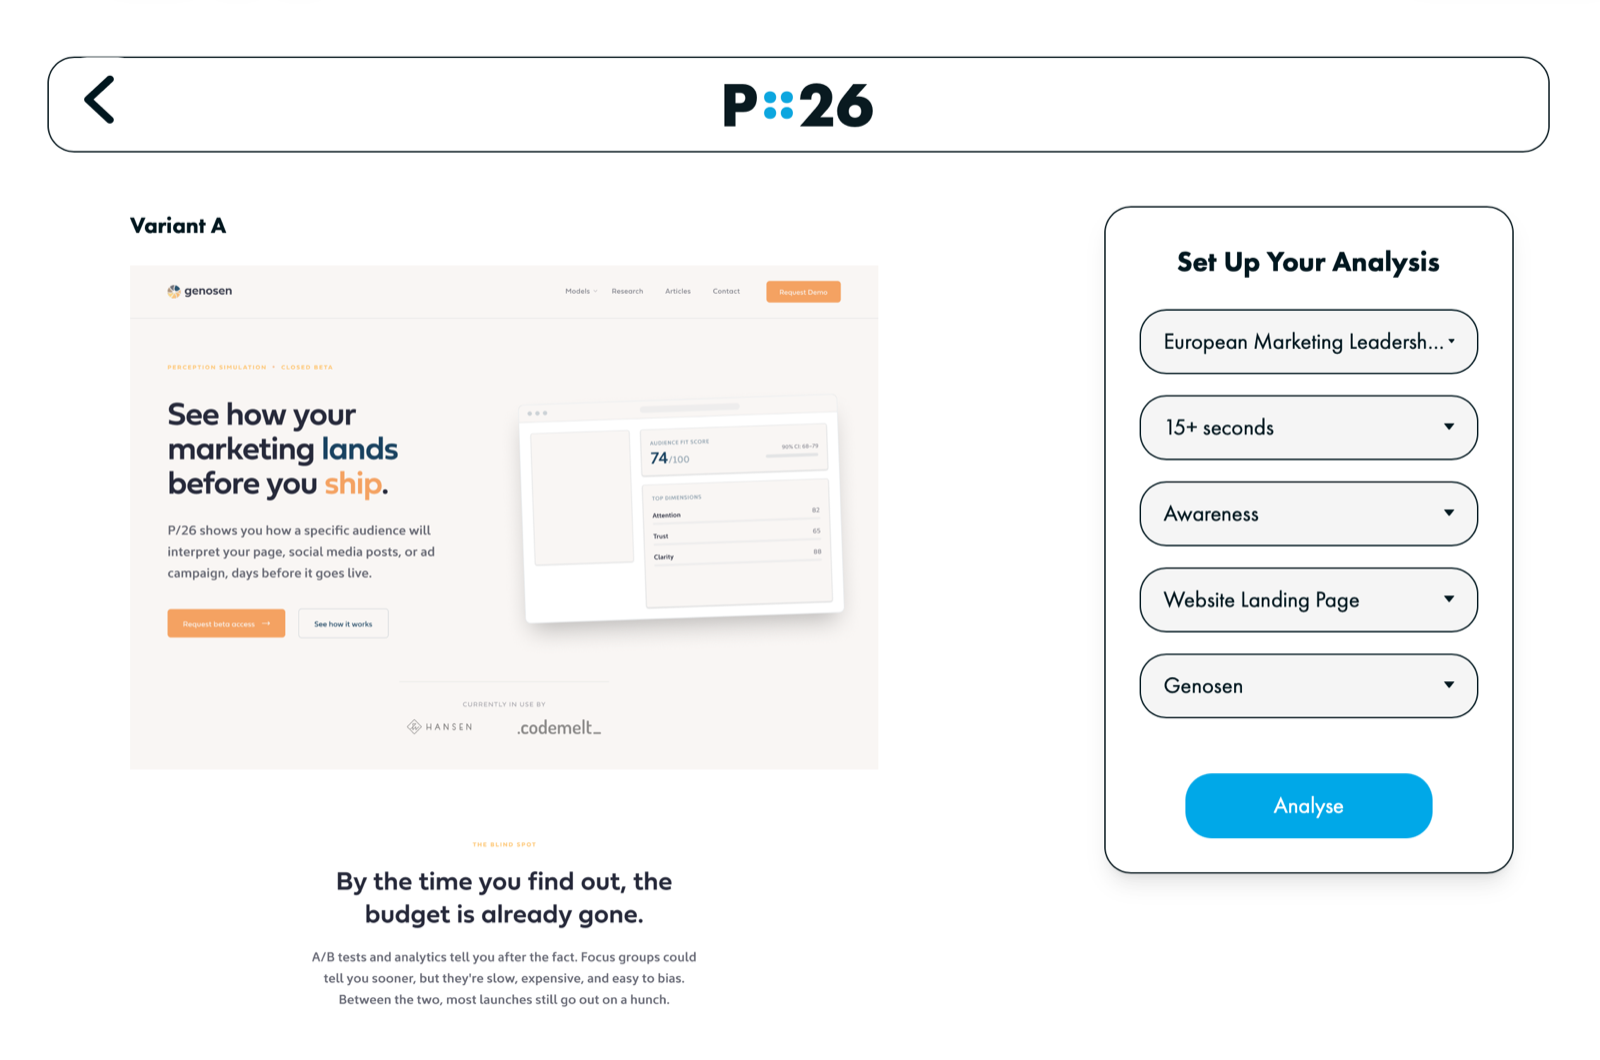
Attach the artefact and its scope
Upload the creative, state what it's meant to achieve, and P/26 evaluates it against that intent.
- Landing pages, social posts, and ads
- Intent is part of the input
- Compare variants side by side
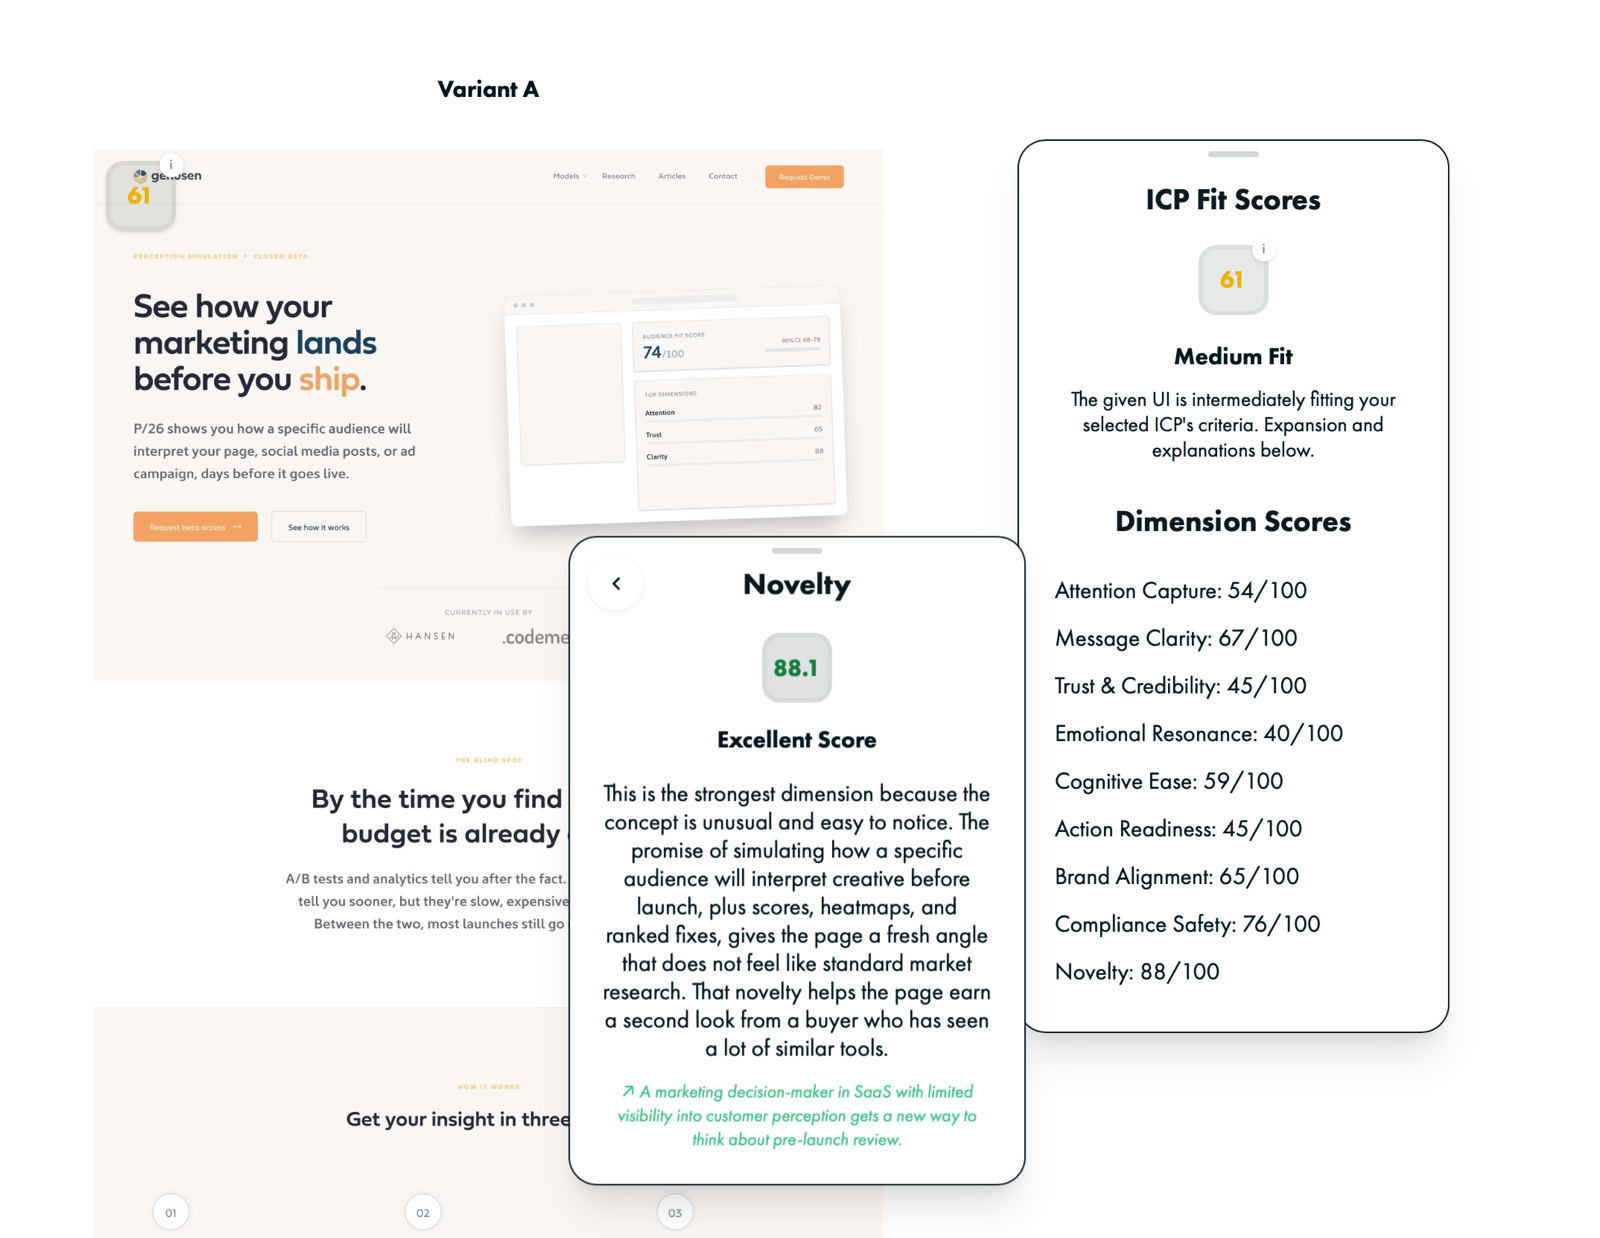
Nine dimension scores, one overall fit score
Every artefact gets a composite Audience Fit Score, plus nine individual dimension scores, each with a plain-language explanation.
- Nine dimensions plus one composite
- Every score explained in writing
- Comparable across variants
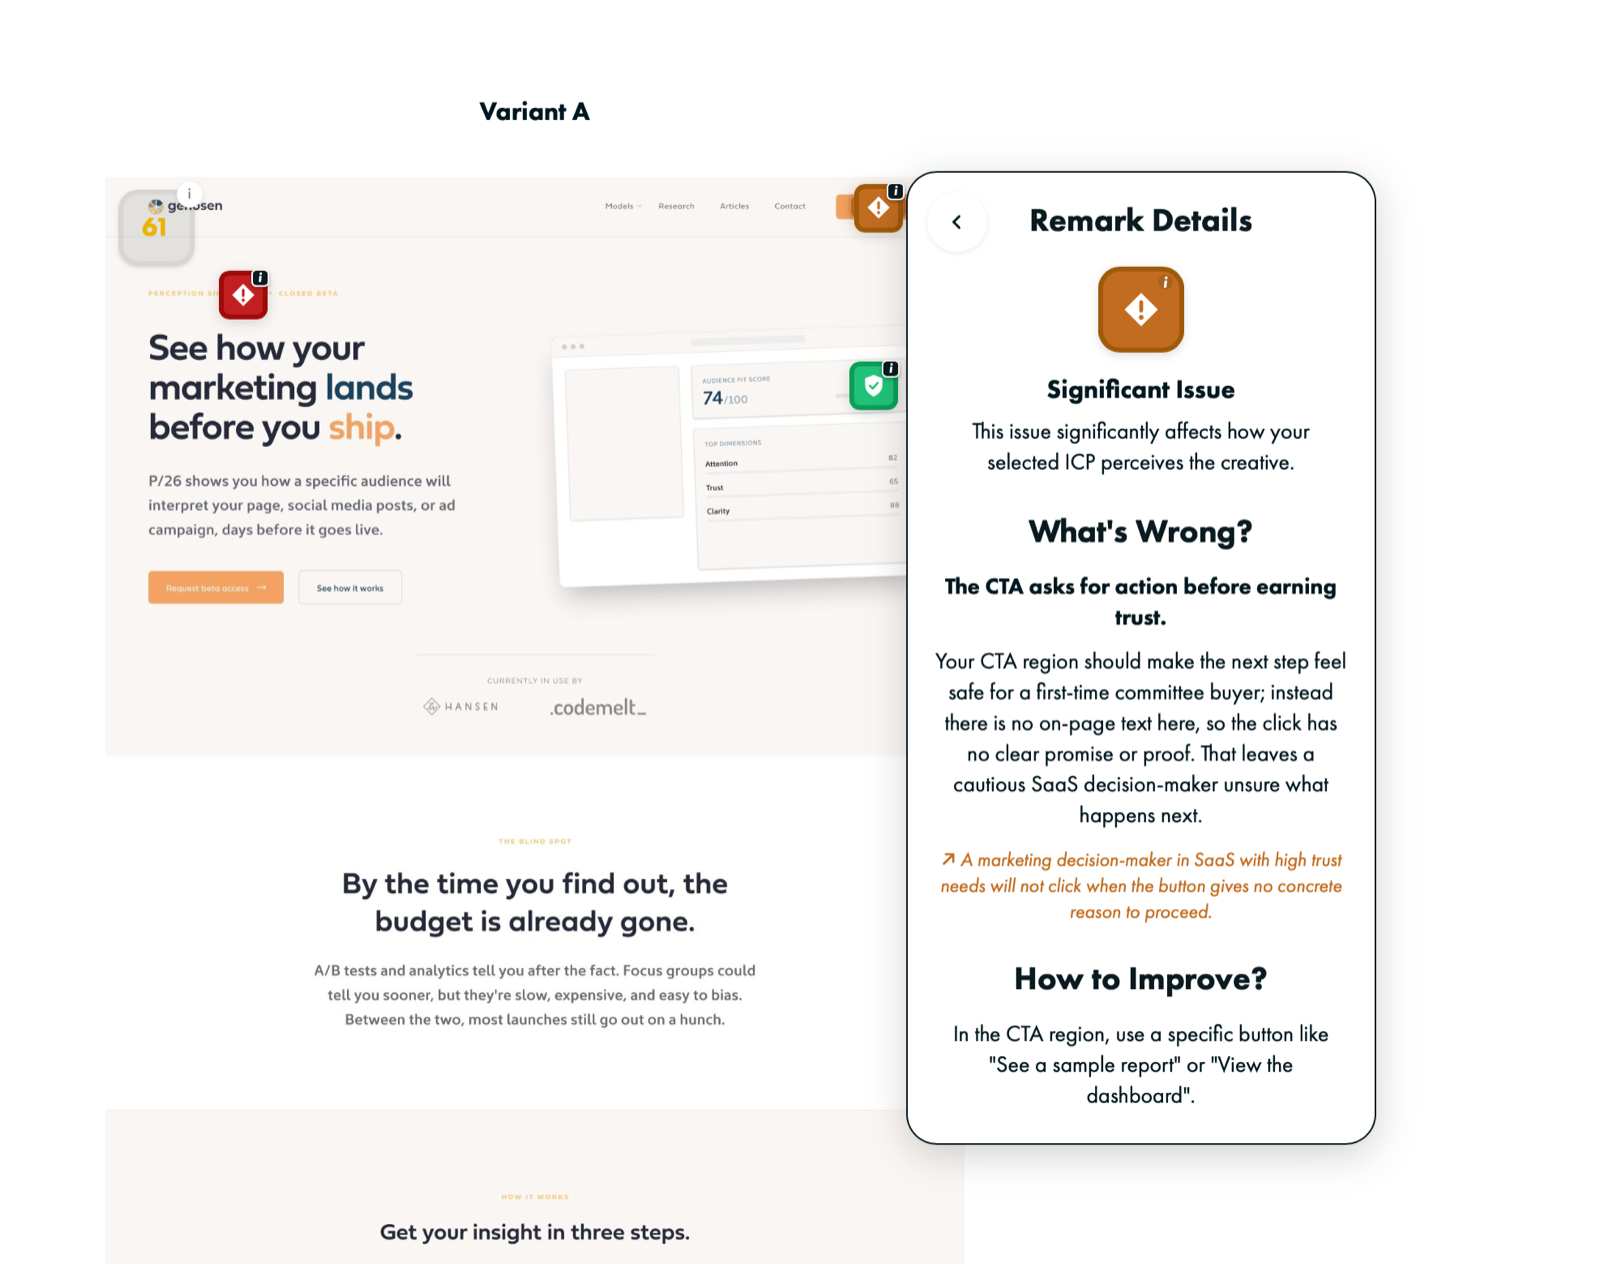
Every flag comes with a fix
Issues are ranked by severity and tied to the exact part of the artefact causing them, with a suggested fix attached to each one.
- Severity ranked: low to critical
- Tied to the exact element
- A fix suggested for every flag
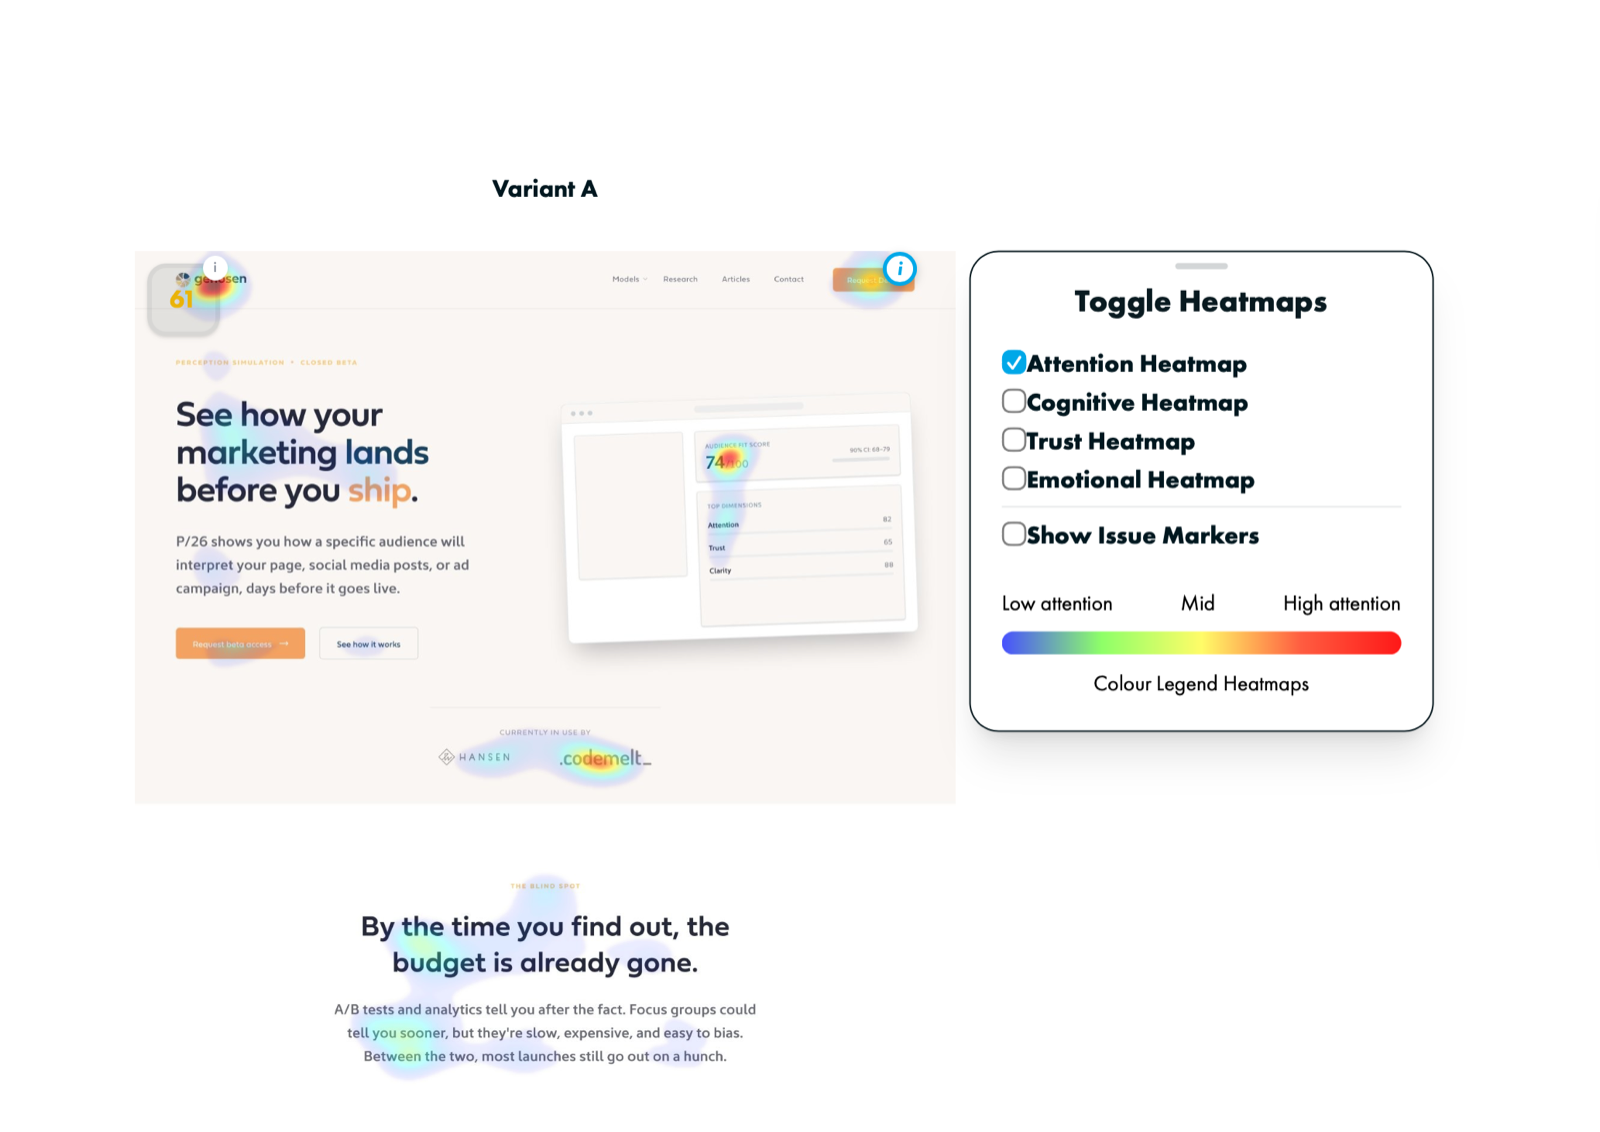
See exactly where attention, trust, and clarity break down
Layered heatmaps show attention, trust, cognitive load, and emotional response across the artefact, so you can see exactly which part is causing the problem.
- Attention heatmap
- Trust heatmap
- Cognitive load and emotional response
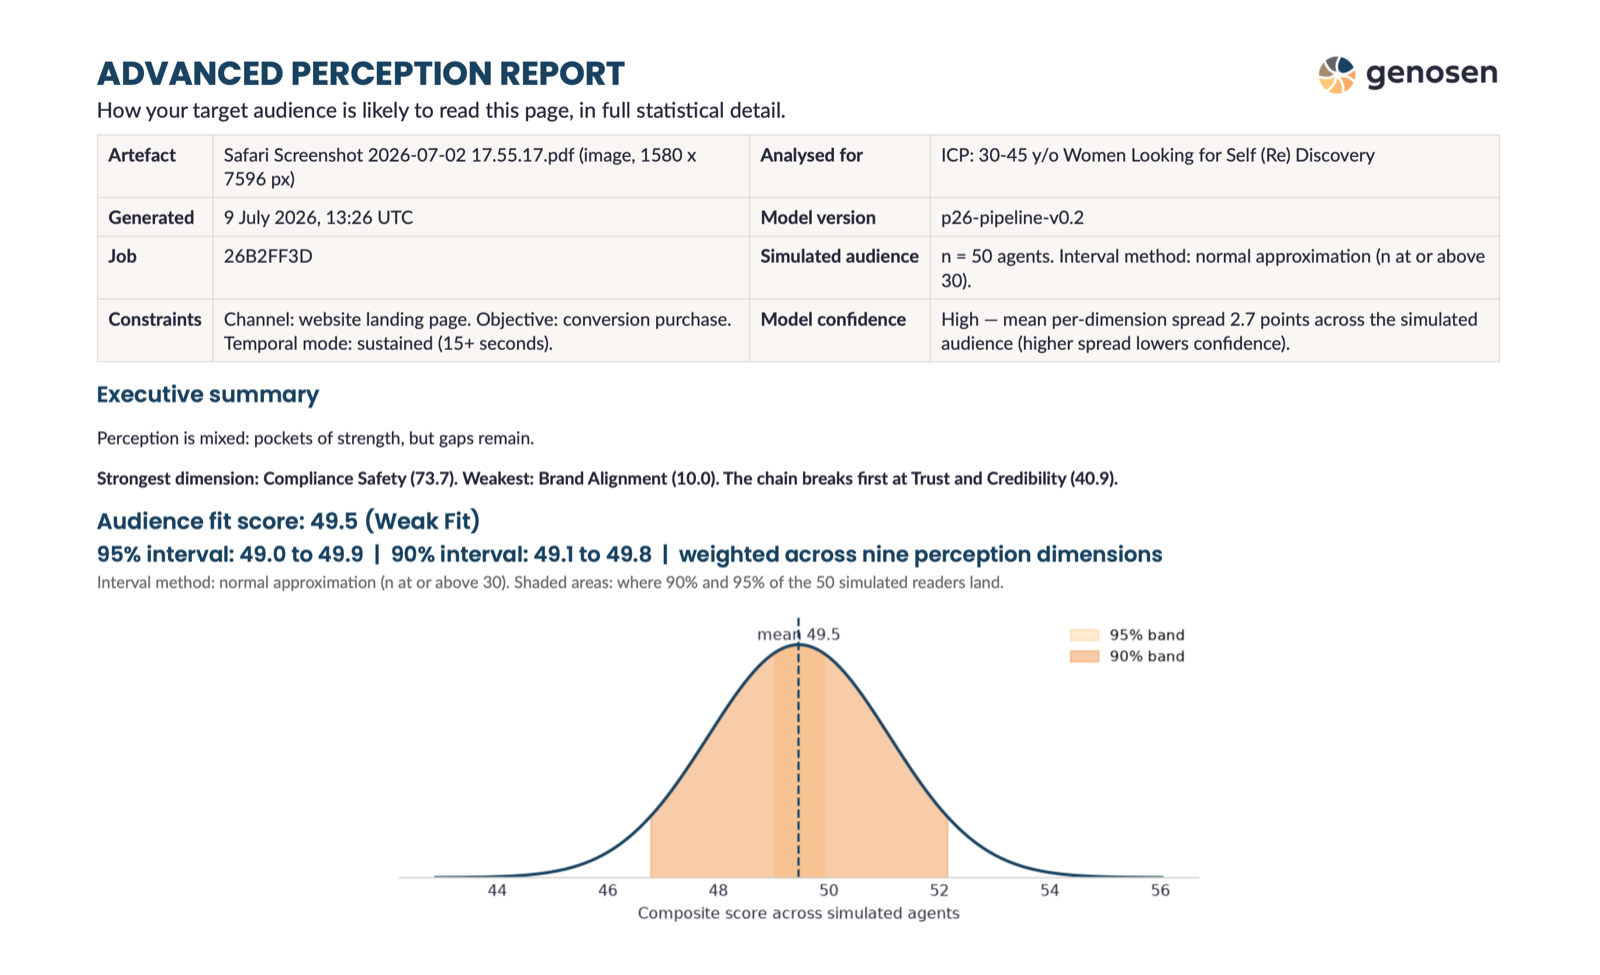
A simple report, or the full statistical read
Export a simple report that summarises the dashboard, or the advanced version with the statistical explanations and confidence intervals behind every score.
- Simple report: the dashboard, summarised
- Advanced report: adds the statistics
- Both exportable for a leadership deck
Nine dimensions. Not a vibe check.
Whether the artefact successfully captures audience focus.
How understandable and cognitively processable the message is.
How credible and coherent the artefact appears.
How well the emotional tone aligns with expected states.
The mental effort required to process the information.
How likely it is to support behavioural movement.
Consistency with established brand constraints and voice.
Risk level associated with regulatory or policy boundaries.
The degree to which the message breaks from category conventions.
Each dimension is mapped to an independently sourced construct in the behavioural science literature. Full methodology in our working paper. Read the working paper.
Created with decision makers in mind
Head of Marketing / Marketing Director
You own the rebrand, the launch page, the narrative. P/26 gives you a defensible read to bring into the leadership review, before the budget is spent.
(Co-)Founder or CEO
A deck, a repositioning, a public statement. Once it's out, there's no do-over. P/26 shows you how it lands while you can still change it.
Agency Founder or Strategist
Your clients have been burned before. P/26 gives you something concrete to put in front of them before you present.
Built for everyday campaigns as much as the big, hard-to-reverse ones. For live traffic analysis, keep your existing tools.
A read, not a replacement
P/26 tells you how your work will be understood before it ships. It doesn't run live campaigns, generate creative, or replace the people who do that work.
The evidence behind your instinct
P/26's model is built on established psychometric and behavioural research. The working paper behind it makes the wider case for why measuring interpretation matters at all: The Missing Layer in Modern AI: Interpretation.
Read the working paperCommon questions
It starts with a demo: we walk through how we'd test P/26 on your work and give you a tour of the interface. If it's a fit, you get a contract where you choose whether to opt in to model training. Then your beta account is ready.
No. A/B testing tells you what happened after launch. P/26 tells you how something will land before it, while the problem is still cheap to fix.
No. Reach and distribution are a different problem. P/26 models interpretation: how a defined audience will understand and feel about what they see.
By default they're processed in isolation and never used for training. If you opt in through your contract, your data can help improve the model. Full terms come before you submit anything.
Every output carries a confidence interval, so you always see how certain the system is. A formal validation study is underway, and we'll publish what we find, mistakes included.
Join the Genosen family
Every company in the beta leaves a mark on P/26. We'd like yours on it too.
Request beta accessWe'll start with a short demo, walk through the tool, and figure out how we'd test it together.